


PORTFOLIO — BUSINESS DASHBOARD
AI Product Monitoring Dashboard
LLMOps + FinOps + Reliability in one decision-ready view. Modern AI features don’t fail loudly—they degrade: latency creeps up, error rates spike by model/region, costs balloon, and quality regressions hide behind stable uptime. Awishcar gives product, engineering, and operations teams a single view across reliability, performance, cost, and AI quality—from executive KPIs down to tenant- and endpoint-level root cause.
Run AI with confidence
p50/p95/p99 latency, error rate, retries and concurrency—broken down by model, region and tenant.
FinOps visibility
Daily spend, cost per 1K requests, token consumption and your top tenants by spend.
Quality & safety
Task success by version, safety-flag volumes, hallucination proxy rate and embedding drift.
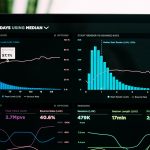
INSIDE THE DASHBOARD
A live look at the dashboard
Executive KPIs, always on
A clean, always-on top row designed for leadership and on-call—so everyone sees the health of your AI product at a glance.
- Requests/min & active tenants
- Error rate; p50/p95/p99 latency
- Cost today + cost per 1K requests
- Input/output tokens & average context length
- Safety flags today


Run AI in production with confidence
Catch latency creep and error spikes before they breach SLAs—broken down by model, region, version, plan and tenant.
- p50/p95/p99 latency by model & region
- Error rate by type; retries & fallbacks
- Queue depth & concurrency
- Latency heatmap by hour-of-day
Control costs with FinOps visibility
Make spend legible. See exactly where the money goes across models, requests and tenants—and where to optimise.
- Daily spend & cost per 1K requests
- Token consumption by model
- Cost per request over time
- Top tenants by spend


Detect quality regressions & safety risk
Quality issues hide behind stable uptime. Surface regressions and safety signals before they reach your customers.
- Thumbs-up rate & task success by version
- Safety-flag volumes & hallucination proxy rate
- Embedding drift & prompt-topic distribution
- Catch regressions the moment a version ships
Part of our Operational Intelligence Dashboards — see also SaaS Churn Risk Intelligence.
Who it’s for
- Product teams shipping AI features needing quality + adoption signals
- Engineering / Platform teams running inference, gateways, and RAG pipelines
- SRE / On-call teams managing latency, error budgets, and incident response
- FinOps / Leadership teams tracking spend, unit economics, and profitability
Potential data sources we can integrate
Observability & telemetry
- OpenTelemetry (OTel) traces/metrics/logs
- Prometheus metrics (service + infra + GPU exporters)
- Grafana visualization layer
- Loki / ELK log aggregation
- Jaeger / Tempo distributed tracing
AI/LLM and model serving
- Provider APIs & logs: OpenAI, Anthropic, Google, Azure OpenAI, AWS Bedrock
- Model gateways: Kong, Envoy, NGINX, custom/LLM routing layers
- Self-hosted inference: vLLM, TGI, Triton, Ray Serve, Kubernetes serving
- GPU telemetry: NVIDIA DCGM exporter, node/pod metrics, autoscaling signals
Application & product analytics
- App events: Segment, RudderStack, Snowplow, Amplitude/Mixpanel
- Feature flags & releases: LaunchDarkly, ConfigCat, custom rollout metadata
- User feedback: in-app ratings, thumbs up/down, human QA, annotation tools
Data platforms & business systems
- Data warehouses/lakes: Snowflake, BigQuery, Redshift, Databricks, S3/ADLS/GCS
- Streaming: Kafka, Kinesis, Pub/Sub
- Billing/usage: Stripe, Chargebee, cloud cost exports (AWS CUR, Azure, GCP)
- Support & CRM: Zendesk, Intercom, HubSpot/Salesforce
RAG / knowledge systems
- Vector DBs: Pinecone, Weaviate, Milvus, pgvector, OpenSearch vector
- Knowledge sources: Confluence, Google Drive, SharePoint, Notion, internal docs
- Search: OpenSearch/Elasticsearch for hybrid retrieval analytics
Reduce incidents. Improve latency. Control spend. Operate safer AI.
A single dashboard and a data model designed for multi-tenant AI products. Talk to us to get started.
Talk to Us
Tell us about your data stack and what you want to measure. We’ll show you how a tailored dashboard would work for your team.
Ready to operate AI with confidence?
We deliver a working AI-monitoring MVP tailored to your stack, with optional ongoing support.